
Using Analytics
to Improve User Experience
The use of analytics to improve UX should be part of every small business website strategy. Data reveals where visitors hesitate, what they ignore, and which messages actually move people toward a purchase or call. This guide explains which metrics to track, how to interpret them, and how to turn those insights into prioritized design and copy changes that reduce friction and boost conversions.
Why data matters:
The truth about first impressions
People form split-second impressions of a website’s credibility and purpose, and design strongly influences those impressions. Using analytics shows whether your initial message lands and where visitors drop off. Measuring behavior helps you validate design and copy choices rather than guessing. (Source: Nielsen Norman Group)
Start with clear goals
and the right metrics
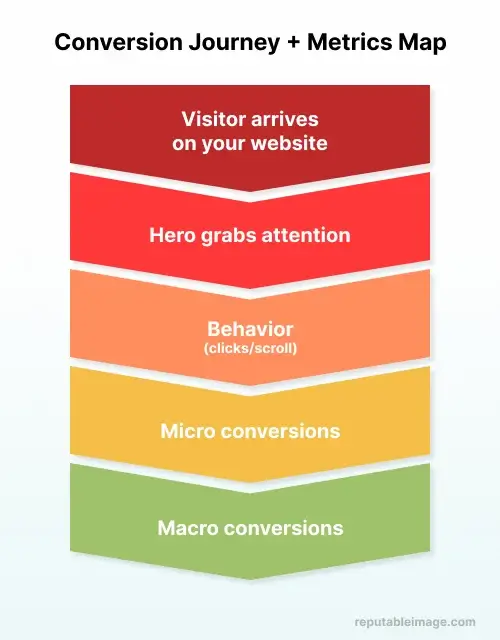
Before you install tools, choose what 'success' looks like to your small business. Typical primary metrics for small business sites include: conversion rate (form submissions, bookings), bounce rate on key landing pages, and micro-conversions (CTA clicks, brochure downloads). Pair those with engagement metrics like time on page and scroll depth to understand engagement versus quick bounces.
Event tracking:
Capture real interactions
Pageviews tell an incomplete story. Events capture the user interactions that reveal intent — clicks, video plays, form starts, and outbound link taps. Implement event tracking (via GA4, Google Tag Manager, or a similar tool) so you can see exactly which elements get attention and which don’t. This is essential if you want to measure the impact of copy or layout changes. (Source: Google for Developers)
Heatmaps and session replays:
See behavior visually
Heatmaps aggregate clicks, taps, and scroll behavior to show what users actually interact with. Session replays let you watch individual sessions and spot confusion (clicks on non-clickable elements, hesitation, or repeated form errors). (hotjar) These qualitative tools help diagnose issues quickly and inspire concrete fixes — for example, moving a CTA to the area with the most activity or shortening a headline where users stop scrolling. Keep your tracking and backups current—see our Regular Maintenance for Small Business Sites checklist.
Make your hero section
trackable and testable
The hero (top of page) is your elevator pitch — test it. Give the primary CTA an event ID, add scroll depth monitoring to see if users read supporting bullets, and run a simple A/B test on headline wording or CTA text. Track which headline variant increases CTA clicks and reduces immediate bounces. Small changes here often deliver the biggest uplift.


Pair testing with solid design — follow our UI/UX Best Practices for Small Business Websites to make the hero scannable and effective.
For headline formulas and CTA examples you can test, see our Copywriting Strategies for Small Business Websites.
Turn analytics into
a prioritized backlog
Raw data creates ideas; prioritized experiments create results. Use analytics to build a ranked list: (1) fixes with highest potential impact and low implementation cost, (2) items needing creative work (copy, layout), and (3) bigger redesigns. Example quick wins: shorten the hero supporting sentence, add a trust cue near CTA, compress form fields. Prioritize based on potential lift (estimated) and effort.
Use segments to
understand traffic quality
Not all traffic behaves the same. Segment your analytics by source — organic, paid, email, social — to see which channels bring the most qualified visitors. If paid traffic bounces more, the landing copy may not match ad messaging. If organic traffic spends more time but converts less, consider clearer CTAs or stronger value alignment on the landing page.
Mobile-first
measurement and fixes
Many users arrive on phones; mobile behavior differs from desktop. Compare mobile vs. desktop bounce rate, session duration, and conversion rate. If mobile underperforms, simplify the hero, make CTAs larger, and reduce content that forces horizontal scroll or slow loads. Monitor improvements after each change to validate impact.
Run small experiments
and learn fast
Make a hypothesis, change one variable, and measure. Example hypothesis: 'Removing one sentence from the hero will increase CTA clicks by 8%.' Run the test to statistical significance, record outcome, and either roll out the winner or iterate again. Keep a test log — successful experiments become reusable patterns across pages and campaigns.
Common pain points analytics helps solve
-
Unclear value proposition: High bounce, low scroll depth. Analytics show where messaging fails.
-
Low conversions despite traffic: test CTAs and form friction with event tracking.
-
Mobile drop-off: mobile metrics point to layout and speed fixes.
-
Inefficient ad spend: channel segmentation reveals poor-performing sources.
Long-term benefits
for small businesses
Using analytics to improve UX turns guesswork into repeatable wins. Over time, you’ll lower customer-acquisition costs, increase lifetime value, and reduce support inquiries by delivering clearer messaging and simpler journeys. Data-driven iteration avoids expensive full redesigns and delivers compound gains month over month.
Quick starter checklist:
-
Define the primary goal for your homepage and one key KPI.
-
Implement event tracking for the hero CTA and main form.
-
Run one headline A/B test for two weeks.
-
Record a heatmap for your top landing page and watch a few session replays.
-
Prioritize fixes into a backlog and iterate.

Conclusion:
Words, design, and data, together
Using analytics to improve UX is a mindset: measure, learn, and iterate. At Reputable Image, we combine beautiful, user-centered design with persuasive copy, analytics setup, and A/B testing so you can focus on running your business while we improve your site’s performance.
Contact us to send us your homepage and we’ll audit your setup and deliver three prioritized changes you can implement immediately.
Sources:
1. Therese Fessenden at Nielsen Norman Group - "First Impressions Matter".
https://www.nngroup.com/articles/first-impressions-human-automaticity
2. Google Developers - Resources on conversion copywriting, CTAs, and inbound messaging.
https://developers.google.com/analytics/devguides/collection/ga4/events
3. Hotjar - Heatmap analysis guide
https://www.hotjar.com/heatmap-analysis